1. Preparing a handwritten Roman numerals dataset
Categories:
Tags:
OpenCV, Matplotlib, Synthetic Data, Competition, Created dataset
A novel data science competition…
If you have ever been involved in data science (DS) or machine learning (ML), even briefly or tangentially, you will be well aware of data science competitions. These competitions are an invaluable learning experience for beginning data scientists, while even seasoned professionals often continue participating in these to keep their skills fresh, learn new tricks, interact with fellow competitors, or simply for the fun of it. Oh, and many competitions offer a fair amount of cash to further sweeten the deal…![]()
Kaggle is the largest and most famous DS/ML competition platform, although there are tons of others - DrivenData, AIcrowd, Xeek, Zindi, etc. Most of the competitions held by these platforms follow a similar pattern – the competitors are provided with a dataset and asked to make a model that provides the most accurate predictions for the target variable(s). In other words, the data is held constant, and the models tuned to fit the data.
In June 2021, Andrew Ng announced a Data-Centric AI competition, which turned the problem on its head. Here, the model (a modified ResNet50, which is a convolutional neural network – more on these in a later post…) was kept fixed, and the competitors were asked to modify the image data provided in any way they saw fit, subject to a maximum of 10,000 images. This was an interesting challenge, and in line with Dr. Ng’s philosophy that ML technology like neural networks have progressed far enough that major future advances in their application must come not via finetuning their architectures but through improvements in the data fed to these models, an area that has been neglected so far.
So what was the challenge itself? It was to enable the model provided to recognise hand-written Roman numerals. In other words, the competitors had to create a Roman numerals version of the famous Modified National Institute of Standards and Technology (MNIST) dataset. The winners were selected on two tracks - the best overall leaderboard score, and the most innovative approach, as decided by a jury. Unfortunately, my entries did not finish in the top three in either category, but no matter – it was a great learning experience! This blog post will focus on the methods I used for the dataset preparation, while next time we will look at training a model on some such datasets.
The data provided
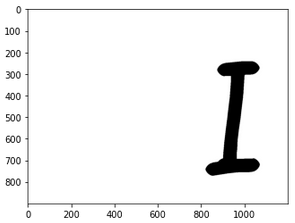
As mentioned above, the competition organisers provided some data to get started. This data was grouped into two folders – train and val, i.e., training and validation. Each folder have ten sub-folders – i to x. As you can guess, each subfolder contained images of handwritten Roman numerals, from 1 to 10. The number of images in each folder varied – for the training folders, from 157 to 281, and for the validation folders, from 77 to 84. As part of the challenge, we were free to move images from the training to validation folders or vice versa, as desired, augment or curtail the number of images, or do anything else one saw fit, as long as the total number of images remained below 10,000. A quick glance at the data, though, made clear what the very first step ought to be…
Removing bad data
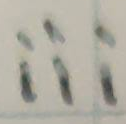
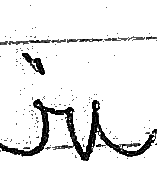
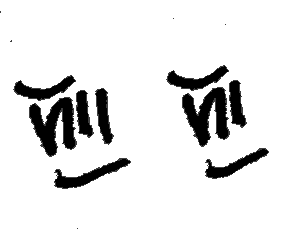
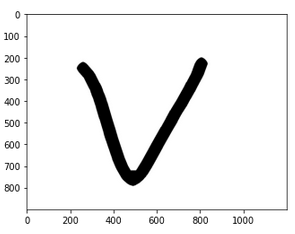
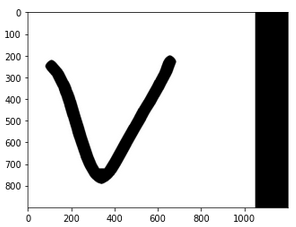
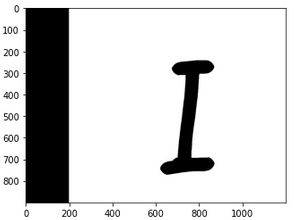
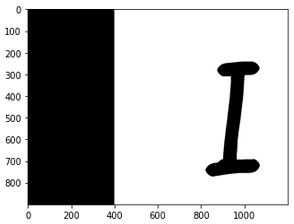
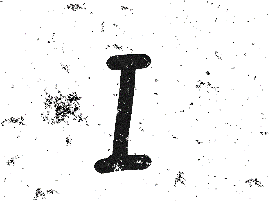
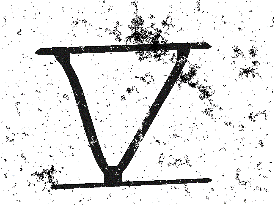
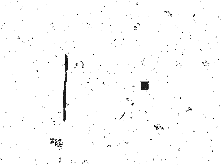
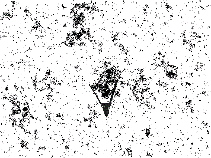
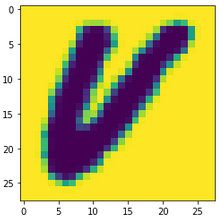
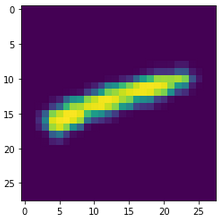
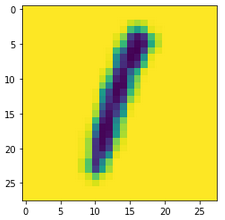
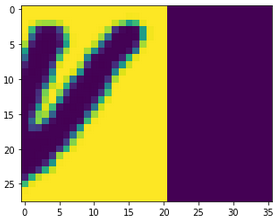
The first thing one could see while looking at the images provided was that many of them were…strange. Have a look:


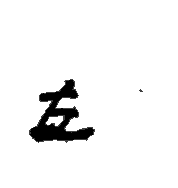


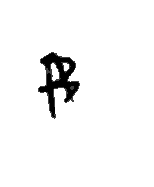
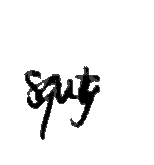

It was clear that these had to go. However, while deciding on which image to remove, I had to be careful not to make the images left behind too clean – after all, the model must learn to recognise images even if they are not squeaky clean and perfectly written. A good thumb rule in these cases is to remove images that you yourself are unable to recognise, and keep the rest. The pix shown above are clearly undesirable, and so these, and similar images, were removed. There were also several instances of images being in the wrong folder (e.g. 5 or 10 in the folder for 2), and I put these in the right place.
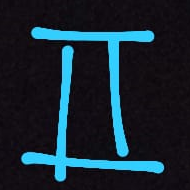
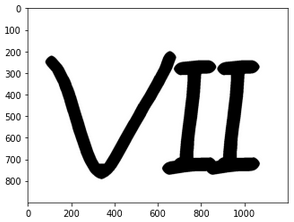
Gathering own data
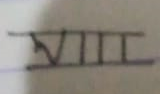
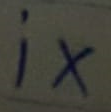
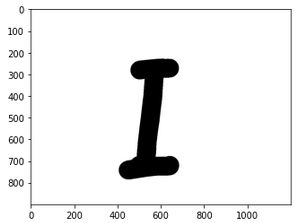
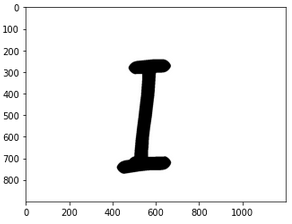
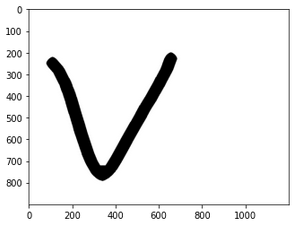
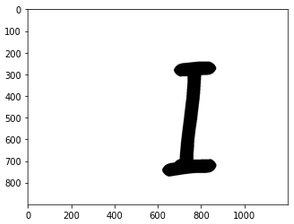
Eliminating all the bad images left something like 2500 images in all, well below the max limit of 10,000. In general, deep learning systems tend to perform better with more data, which meant that gathering more images snapped in different settings would be a good way to make the dataset more diverse and robust. My way of doing this was relatively straightforward – I clicked pictures of numbers I wrote myself in a variety of styles and conditions, and asked as many relatives and friends as I could, without their thinking I was crazy, to send me their handwritten Roman numerals (thanks everyone!). Chopping the images into the individual numbers was a surprisingly time-consuming and laborious task, and one which made me appreciate afresh the challenges in gathering good quality data. Nevertheless, I was able to gather 300+ images for each number. At the time, I didn’t know whether these resembled the test data or not (spoiler: they didn’t), but I anyway attempted to gather the most diverse set of images possible. Some samples are given below.


Data quantisation
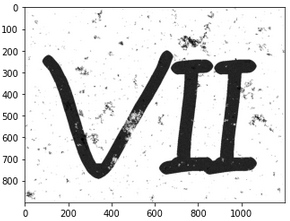
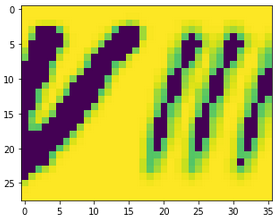
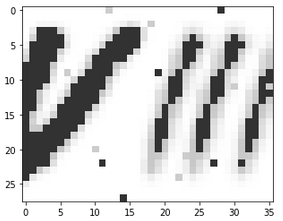
The organisers provided a script for optionally processing the added images so as to make them more similar to data already provided. The script below, which uses the OpenCV library, loads the images in grayscale mode and converts all the pixels that aren’t very dark (brightness of 43 or less) to white. The results can be seen below, with an original image to the left, and the quantised image to the right.
def convert_images(input_folder, output_folder):
    Path(output_folder).mkdir(parents=True, exist_ok=True)
    input_files = glob(os.path.join(input_folder, "*.png"))
    for f in input_files:
        image = cv2.imread(f, cv2.IMREAD_GRAYSCALE)
        # quantize
        image = (image // 43) * 43
        image[image > 43] = 255
        cv2.imwrite(os.path.join(output_folder, os.path.basename(f)), image)

Although this was optional, I chose to undertake this conversion anyway. Since the data provided was in black and white, I felt the test data was unlikely to be in colour, and so would probably resemble the processed images more than the original colour versions (this turned out to be true, btw).
Data manipulation for augmentation
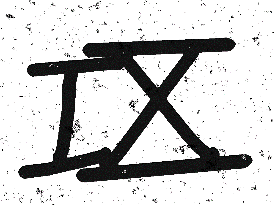
Now, even after gathering my own data, I ended up with less than 6000 images. How to boost the numbers further? One method is via manipulating the existing images. An easy way to do this is flipping the images using OpenCV’s flip method. The small versions of 1, 2, 3 and 10 can be flipped horizontally, while their capital versions can be flipped either horizontally and vertically. For 5, only the horizontal flip is meaningful, while for 9, only the capital 9 can be flipped vertically. Examples:


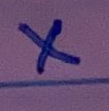
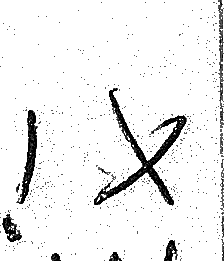
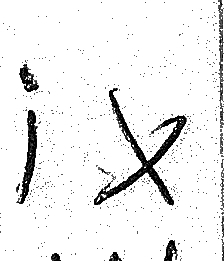
For the numbers 4 and 6, I flipped the numbers horizontally, and put the results in the other number’s folder. Here’s what I mean…the images to the left below are the original, and to the right the flipped versions.


Obviously some flipped images had to be eliminated because the flipped version didn’t quite look right (see the 4 below), while in some others, some manual changes were necessary (the dot of the flipped 9 had to be moved to the top):
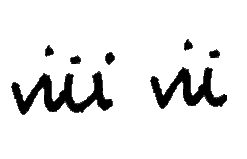
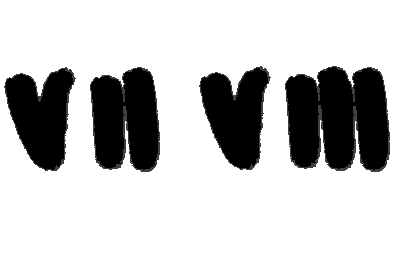
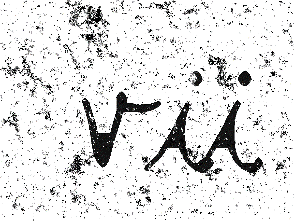
Unfortunately, no sensible flips are possible for the numbers 7 and 8, and so these therefore need to be augmented in a different way. I manually added an ‘i’ to vii’s and removed an ‘i’ from viii’s, as shown below (original to the right in each pair). While effective, this method was laborious and time-consuming, taking me over half an hour to generate a hundred images.
Overall, while the flipping and manual modification methods worked, they did not add all that much diversity to the dataset, and the manual manipulation in particular was very time consuming. I therefore used another method to generate some more images.
Generate synthetic data
In the absence of enough ‘real’ or ‘augmented’ data, synthetic data is a plausible means of increasing data availability, provided the synthetic data is similar enough to the real data. I therefore decided to see how to generate artificial images to boost the number of images. For this, Generative Adversarial Networks (GANs) seemed to be the ideal choice, and hence I first tried them. However, the numbers generated were either virtually identical to those fed, defeating the purpose, or were unrecognisable.
I then decided on a different technique. The Roman numbers in question are all composed of three letters – i, v and x – and hence I decided to compose synthetic numerals based on open-source handwritten datasets. I tried different datasets, including the HASYv2 dataset and the T-H-E dataset, but after a trial and error process settled on the Chars74K and the EMNIST datasets. This was because I felt that these datasets possessed diverse and realistic letters, while also being relatively easy to manipulate into the different numbers.
Chars74K dataset
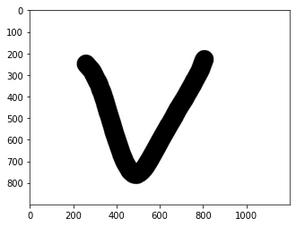
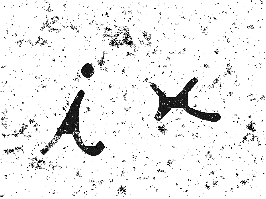
The Chars74K dataset contains 3410 handwritten English characters, with 55 samples each of 62 classes. The authors enlisted 55 volunteers to create the images, so, for instance, the 41st small ‘v’ and the 41st block ‘i’ would have been created by the same individual, something that is of importance when combining the images. Of the 62 classes, only 6 classes (small and block i, v and x) are of interest to us. Samples of the original images are:


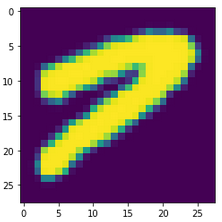
I used different OpenCV methods to combine the parent images into the different numerals. First, I shifted the parent numerals to the left or the right and then I superimposed the images. For instance, for creating the number 7, a ‘v’ was shifted to the left, an ‘i’ slightly to the right, and another ‘i’ way to the right. I added white rectangles to cover up the area of the shift before superimposing these images (see figure below). To maintain realism, I only combined numerals from the same writer in an image. For example, block letters ‘v’ and ‘i’ from volunteer 23 would only be combined with each other, not with those of any other writer.
As the Chars74K dataset images were composed of thick black lines on a white background, to make them more realistic, I added random levels of Gaussian, uniform and impulse noise to the images, and also dilated them randomly to reduce the letter thickness. Additionally, I manually added horizontal strokes to some capital v’s and x’s to make them more realistic. The original images are large and high quality (1200x900), and I downsized these after modification to 32x32, both to reduce the file sizes and since this would anyway be done prior to feeding to the CNN. The images below show the sequence of making the number 7:

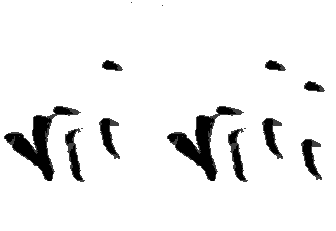
The originals were thus modified and combined into the different numbers as shown in the examples below:


As can be seen, the results obtained were passable copies of the numbers, without being so realistic as to eliminate the need for real data. The random addition of noise and dilation made some samples unusable – these I discarded and created fresh samples in their place. Examples:
The imperfect code for carrying out the above can be found here. Now on to the EMNIST dataset…
EMNIST dataset
The EMNIST (Extended MNIST) dataset has over 800,000 images in an MNIST-like format, making it an attractive option for this task. The dataset has six different splits, of which I decided to use the ‘By Class’ split, as this contains the complete set of samples, unlike four of the other splits, and has the small and capital i, v and x kept separately, not merged into a single letter class like the ‘By Merge’ split. There are 62 classes in this split, containing an uneven number of samples per class. I was obviously only interested in only 6 classes (block and small i, v and x), each of which has over 2000 samples in the EMNIST dataset.
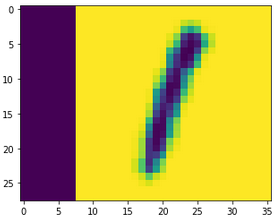
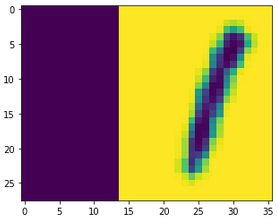
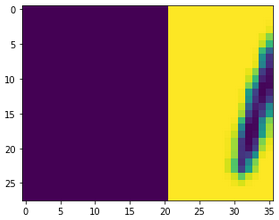
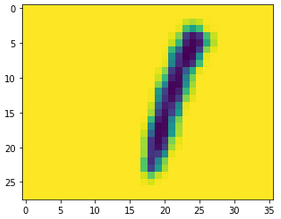
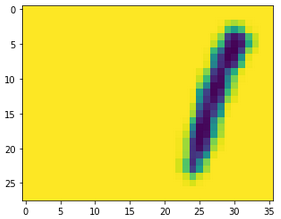
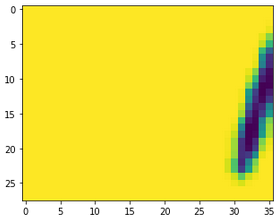
The procedure I used for these images was a little different from that used for the previous dataset. The images had to first be rotated and colour-inverted. Since, unlike the earlier dataset, the EMNIST images are square (28x28), for numbers like 7 and 8, the x-dimension of the images had to be increased to ensure the final figure fit into the image. After this, I shifted the parent numbers to the left or right as described above, and superimposed them. I also again added small amounts of Gaussian, uniform and impulse noise. As the combined image was initially very faint due to the masking applied, I applied a darkening method, converting pixels below 200 in intensity to 50, before converting the images to 3 channels. Finally, as the images were already small, I did not resize them. The sequence can be seen below for a number 8:
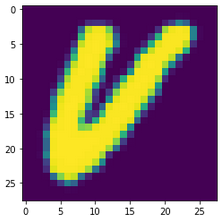

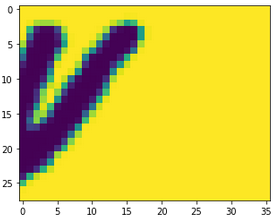
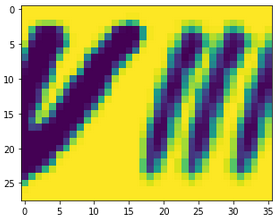
Some of the images created in this fashion are shown below, and the imperfect code used to make them can be found here.


Conclusion
So that’s it, we have seen the various methods I used to create my submissions. Next time we will look at evaluating some of my created datasets using a cut-off Resnet50, as used in the competition, as well as full Resnet versions. So long!